by Will Heinrich
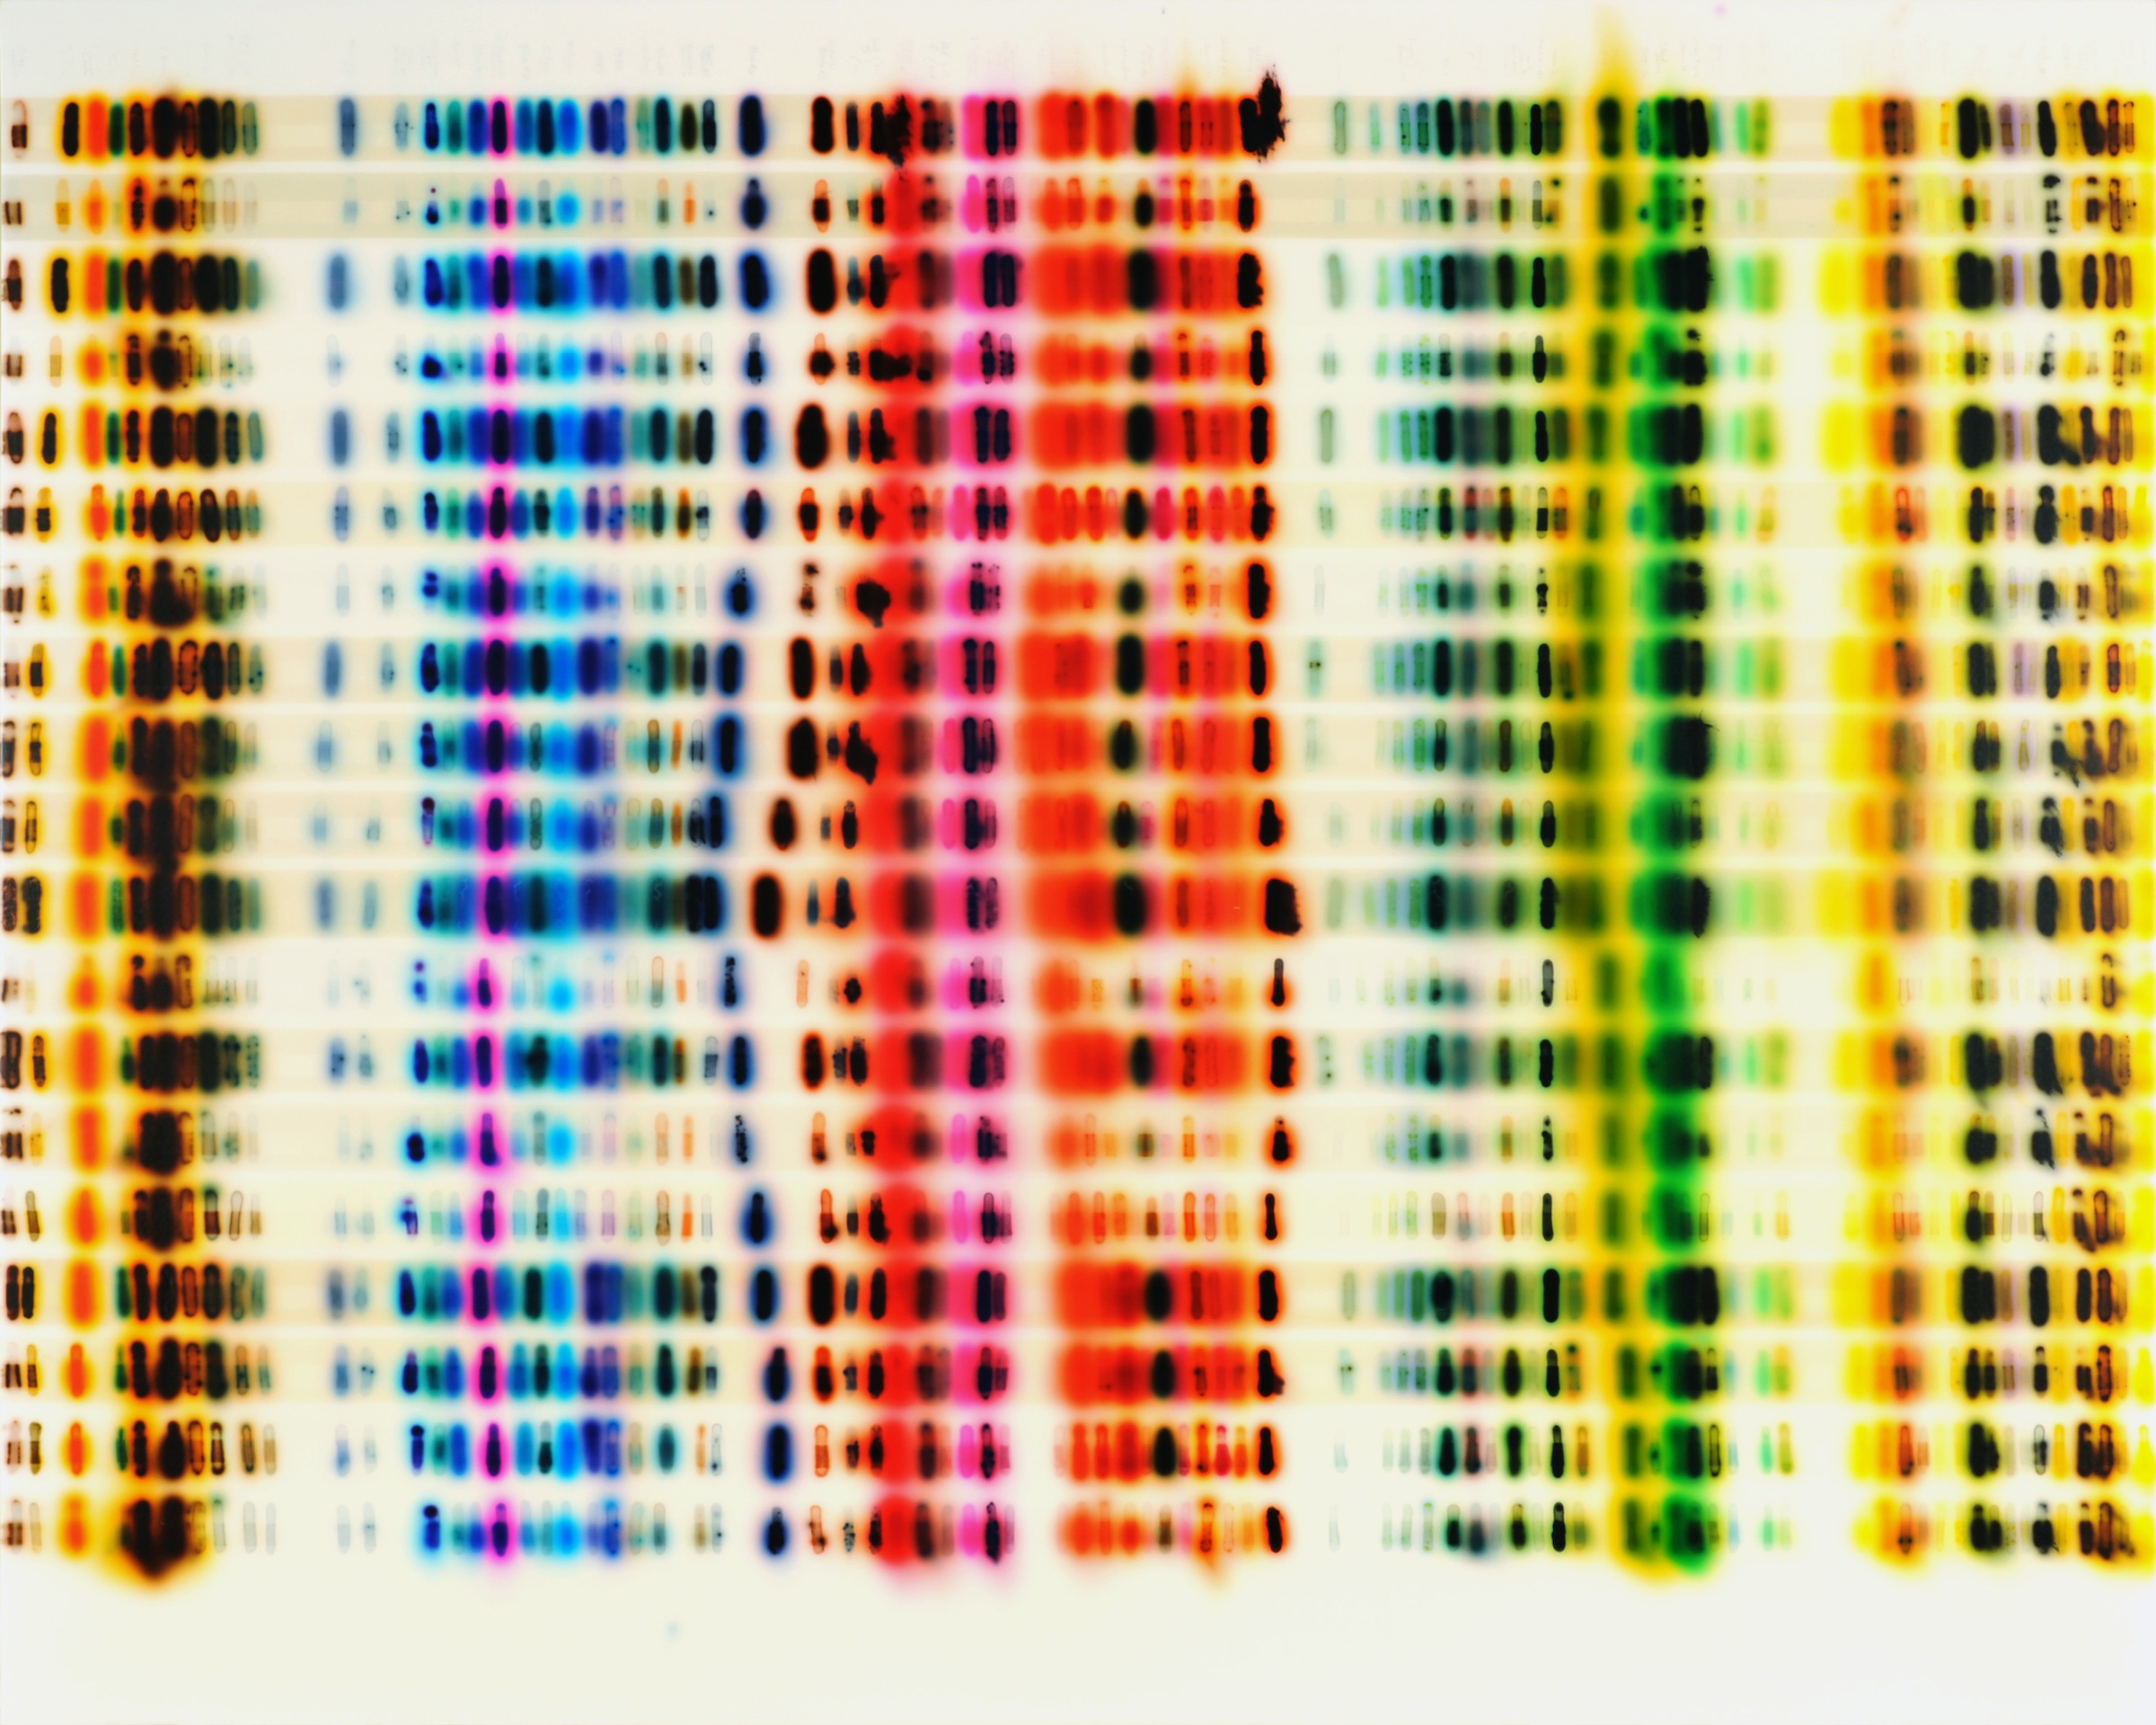
To make Large Spectrum Chart, which is both the highlight of Slow Color at Morgan Lehman and an important reference for its other pieces, Jaq Chartier began with a 40-inch-by-50-inch gessoed white panel. Using an eyedropper, she laid out 19 long rows of small vertical lines in a variety of stains. She covered the stains with spray-painted, horizontal bars in several shades of white. And then she laid over this deceptive whiteness a varnish whose interaction with the paint caused the stains to come blooming through.
The final effect is similar to the gel electrophoresis images used to analyze DNA. The resemblance is intentional: Ms. Chartier’s pictures, too, are full of information. She began using stains this way to test their archival stability, and the sides of Large Spectrum Chart are covered with handwritten notes about which colors are which and what they’re doing. But unlike with images of DNA, the beauty here is also intentional, and the gathering of information, at least as far as we’re concerned, is only a means to an end.
Jaq Chartier | Large Spectrum Chart, 2010 | Acrylic resin, stains, spray paint on wood panel | 40 x 50 inches

